Monitoring
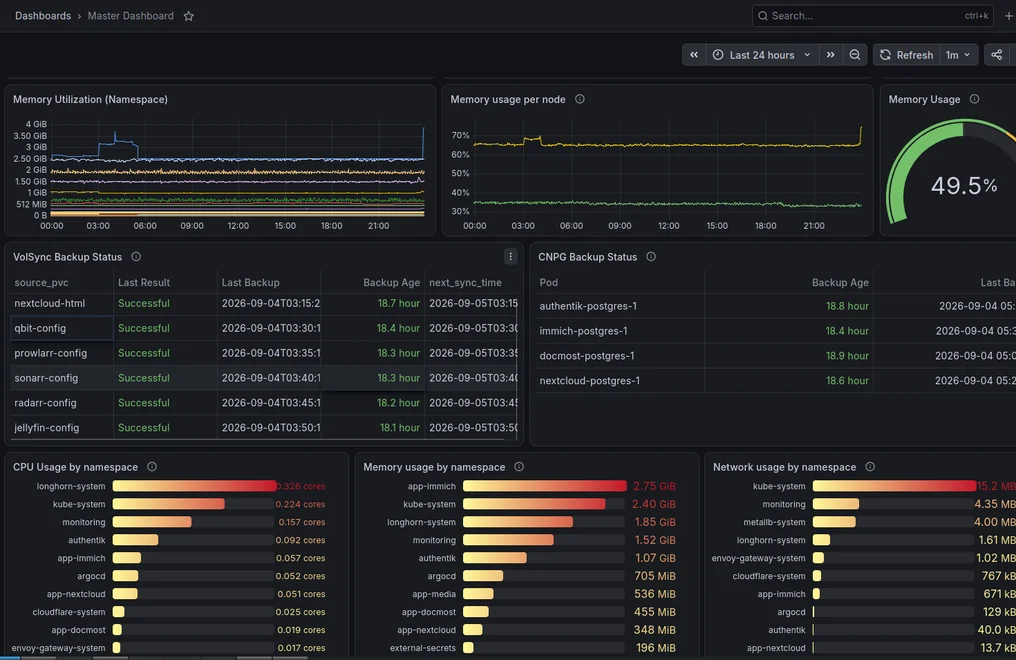
Grafana
Where I look when something feels slow: node health, disk pressure, backups, cert expiry.

Amsterdam · homelab
My photos, files, documents and home automation, all running on my own hardware. Everything below is what that actually looks like.
Services
Seven services doing the work I would otherwise rent. Each one replaced a subscription.
Monitoring
Where I look when something feels slow: node health, disk pressure, backups, cert expiry.
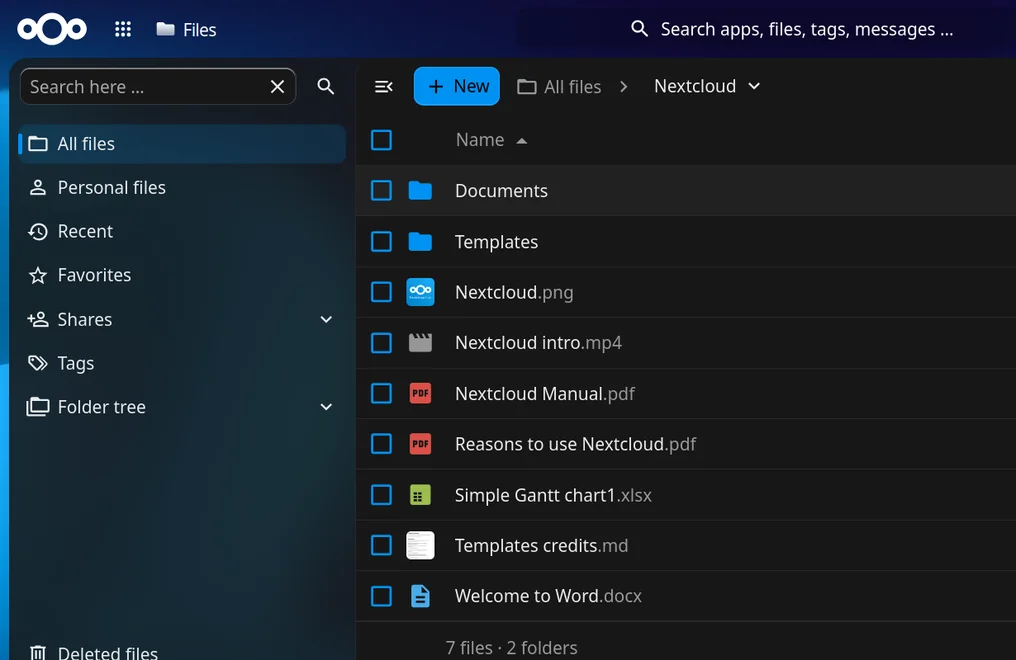
Files
Files, calendars and contacts on every device I own. This one replaced Dropbox.
Photos
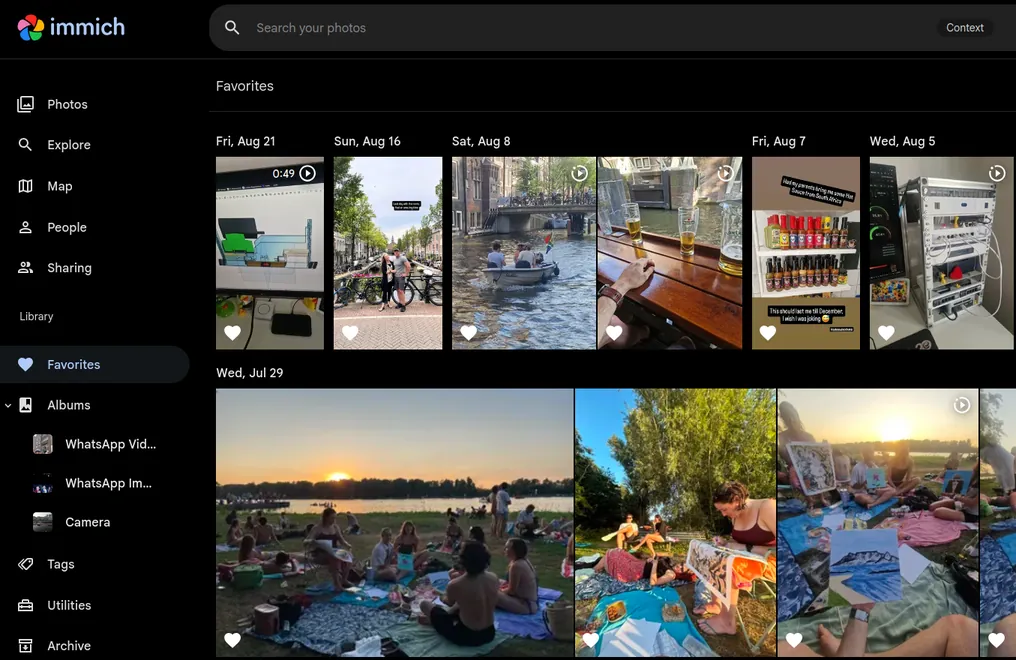
Every photo and video off my phone, on my own disks instead of Google Photos.
Home automation
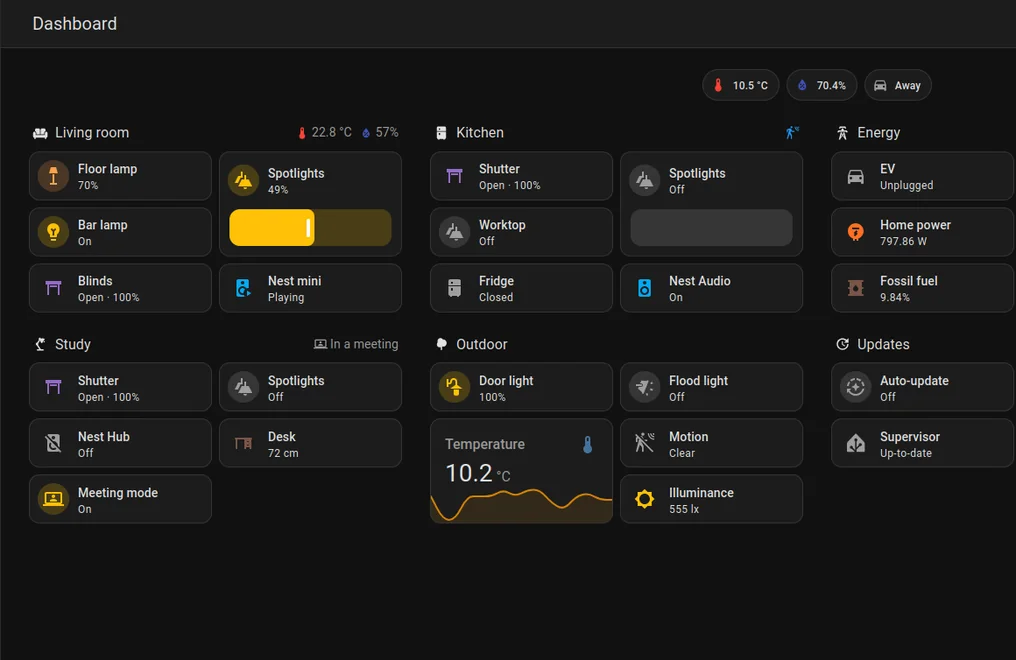
Lights, sensors and switches, automated locally. Nothing stops working when the internet does.
Single sign on
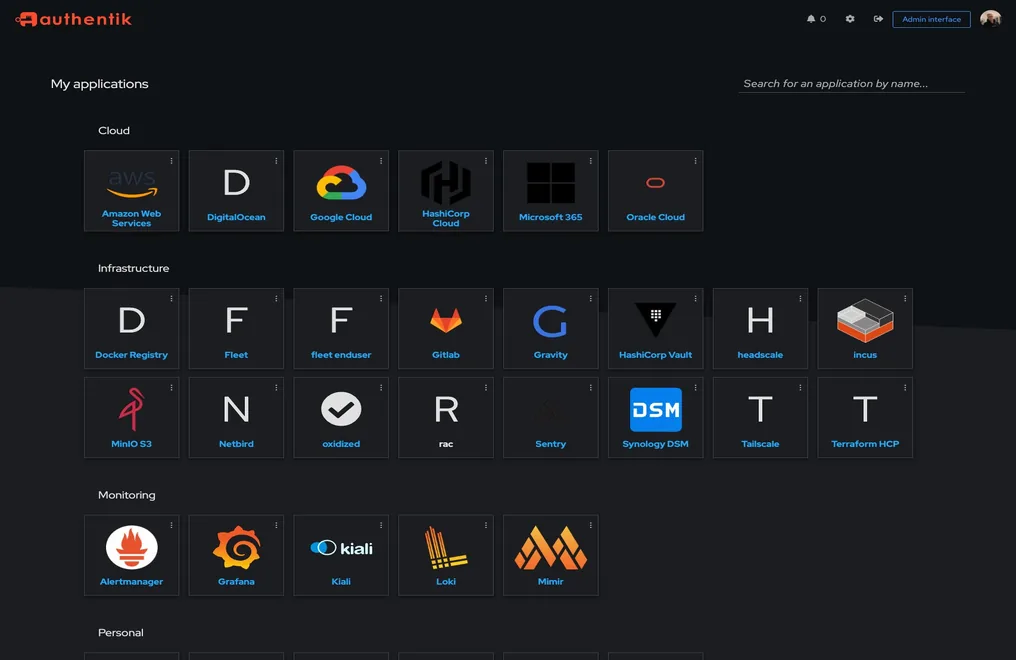
Single sign-on for everything here, so there is one place to revoke access.
Storage
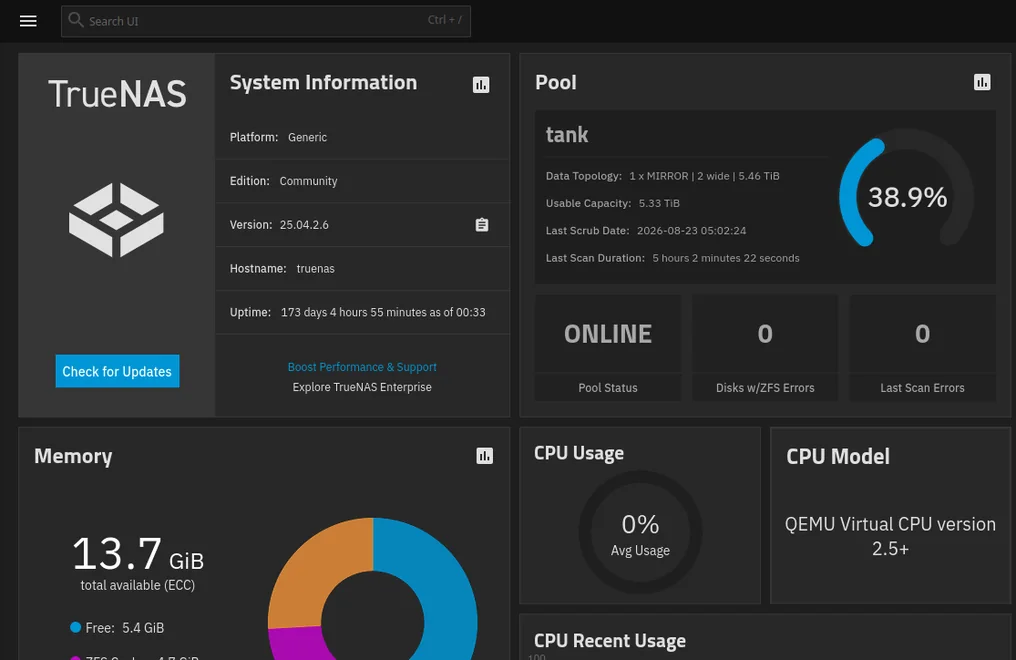
The bulk storage behind everything else. ZFS on spinning disks, snapshotted.
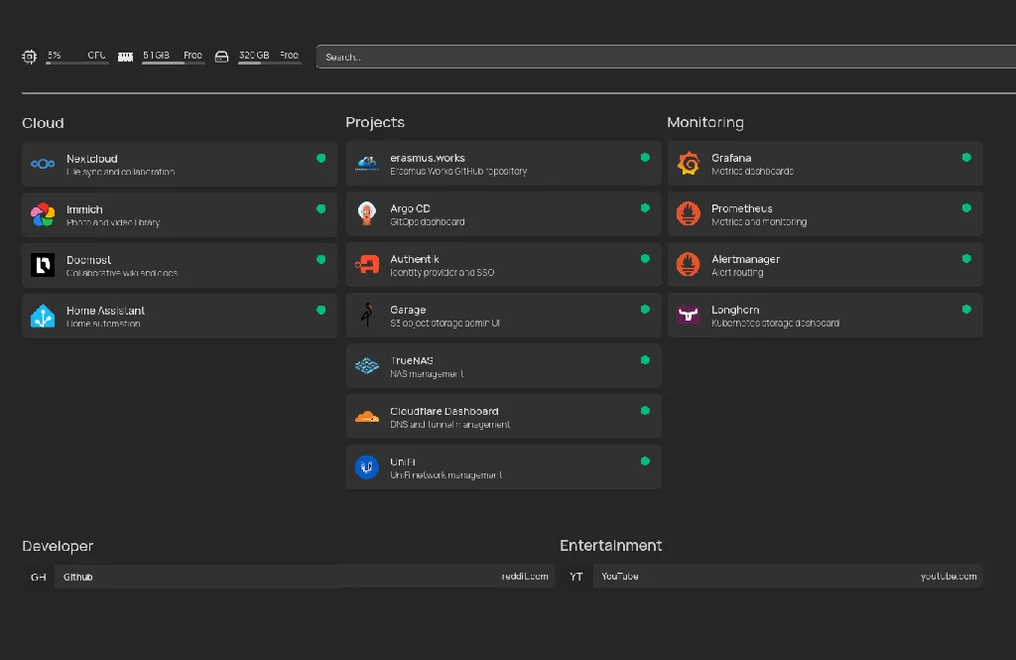
My dashboard
One page linking every service above, with a live status light on each.
Software
Two Talos nodes, one cluster. Argo CD is the only thing that touches it, so merging a pull request is the deploy.
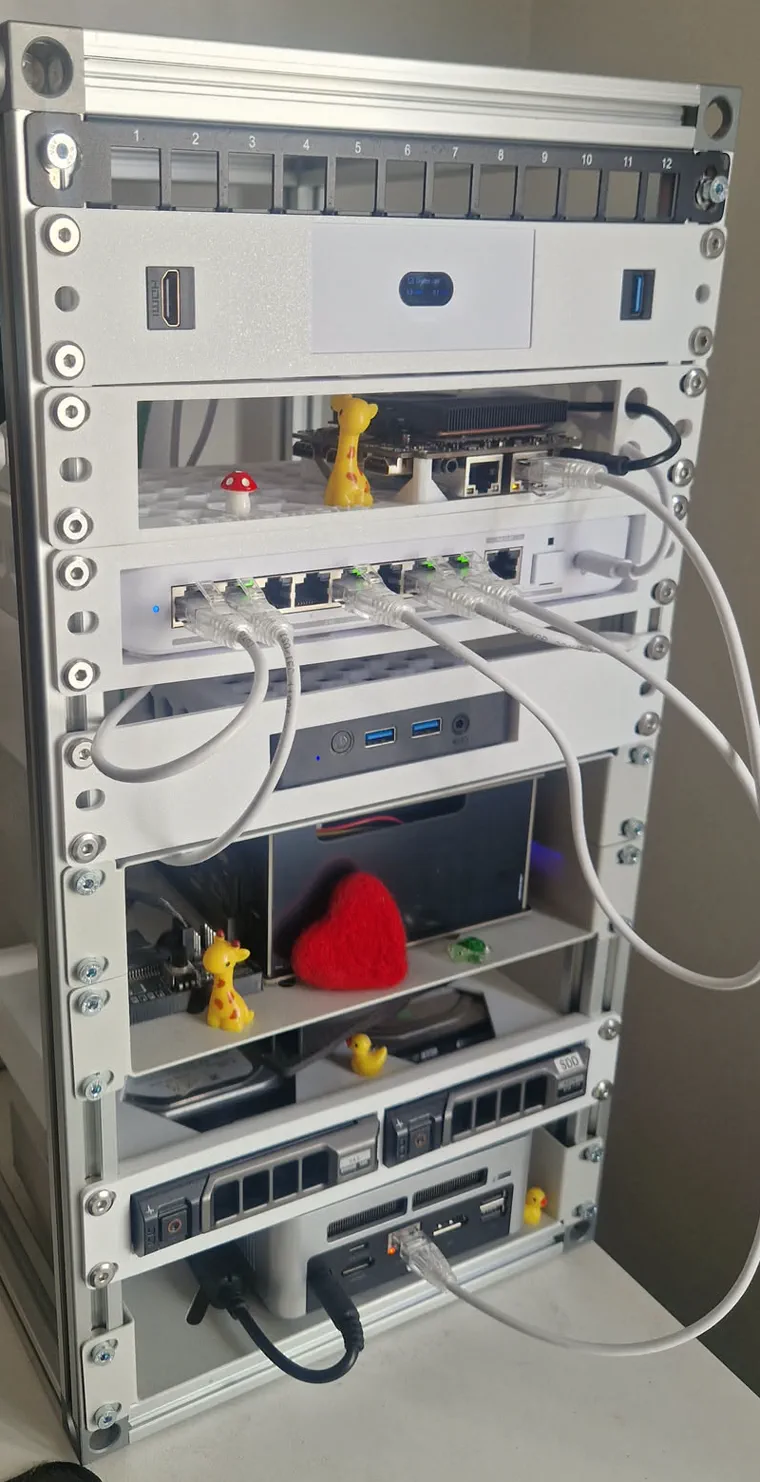
Hardware
No rented server anywhere in this. Ten units of aluminium extrusion, with 3D-printed trays for whatever never came with rack ears.
No power strip fits a 10-inch rack, so the back of it is printed too. It is a stack rather than a strip: every box brings its own module up with it, and nothing else in the rack changes.
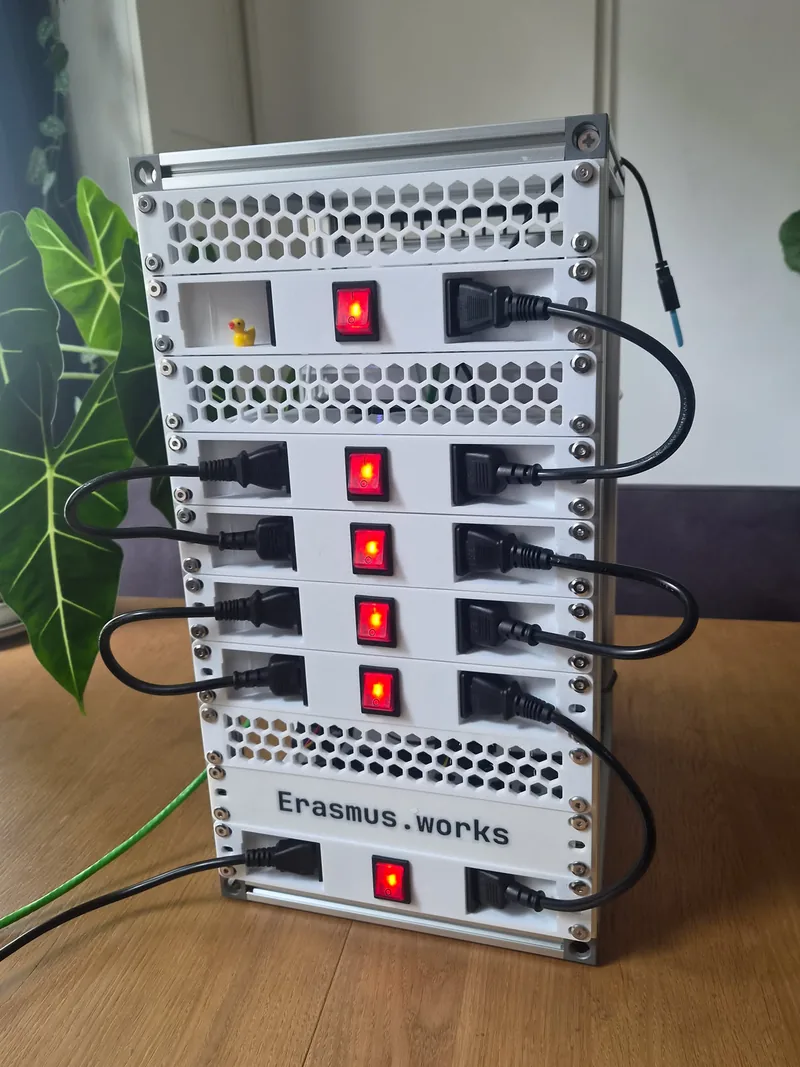
Cut list, parts and the STEP files are open source — build your own
Open source
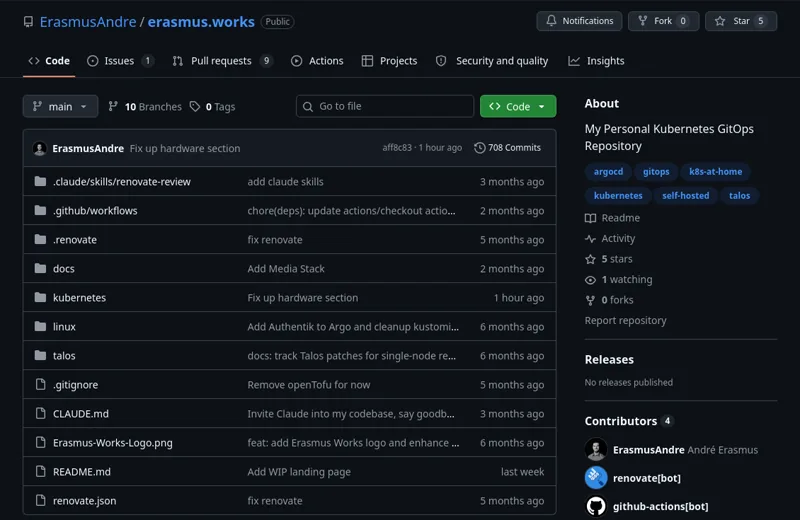
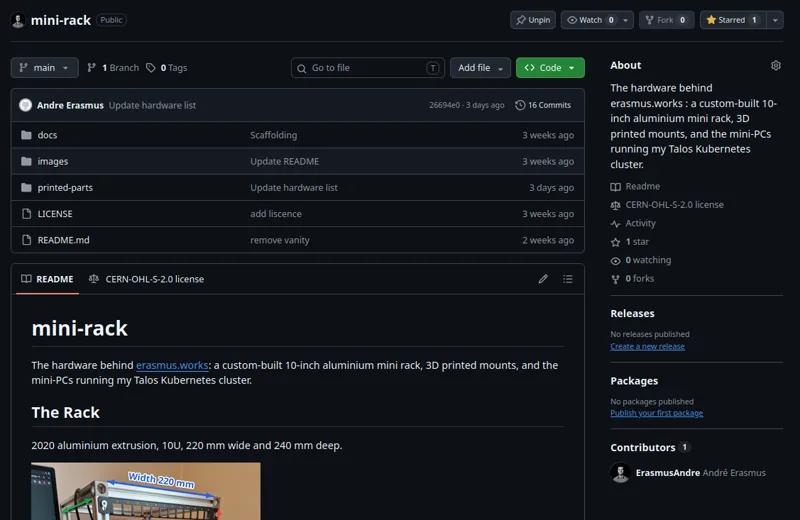
All of it is open source and on GitHub — one repository builds the cluster, one builds the rack.
The software
Every manifest Argo CD applies, the Talos node config, and the Renovate rules.
The hardware
The cut list, the parts and what they cost, plus STEP and 3MF for every printed mount.
Leave a star if you like what you see